


G-Trendalyser 2.0 is my free Google Trends tool. Paste up to 5 keywords, pick a country and a timeframe, then get back every top and rising related query in one place, ready to export.
I built the first version in 2020, watched it break twice, lost the GitHub account it lived on, then rebuilt it from scratch with AI. Here’s the tool, the code and the whole story.
What is G-Trendalyser 2.0? (TL;DR)
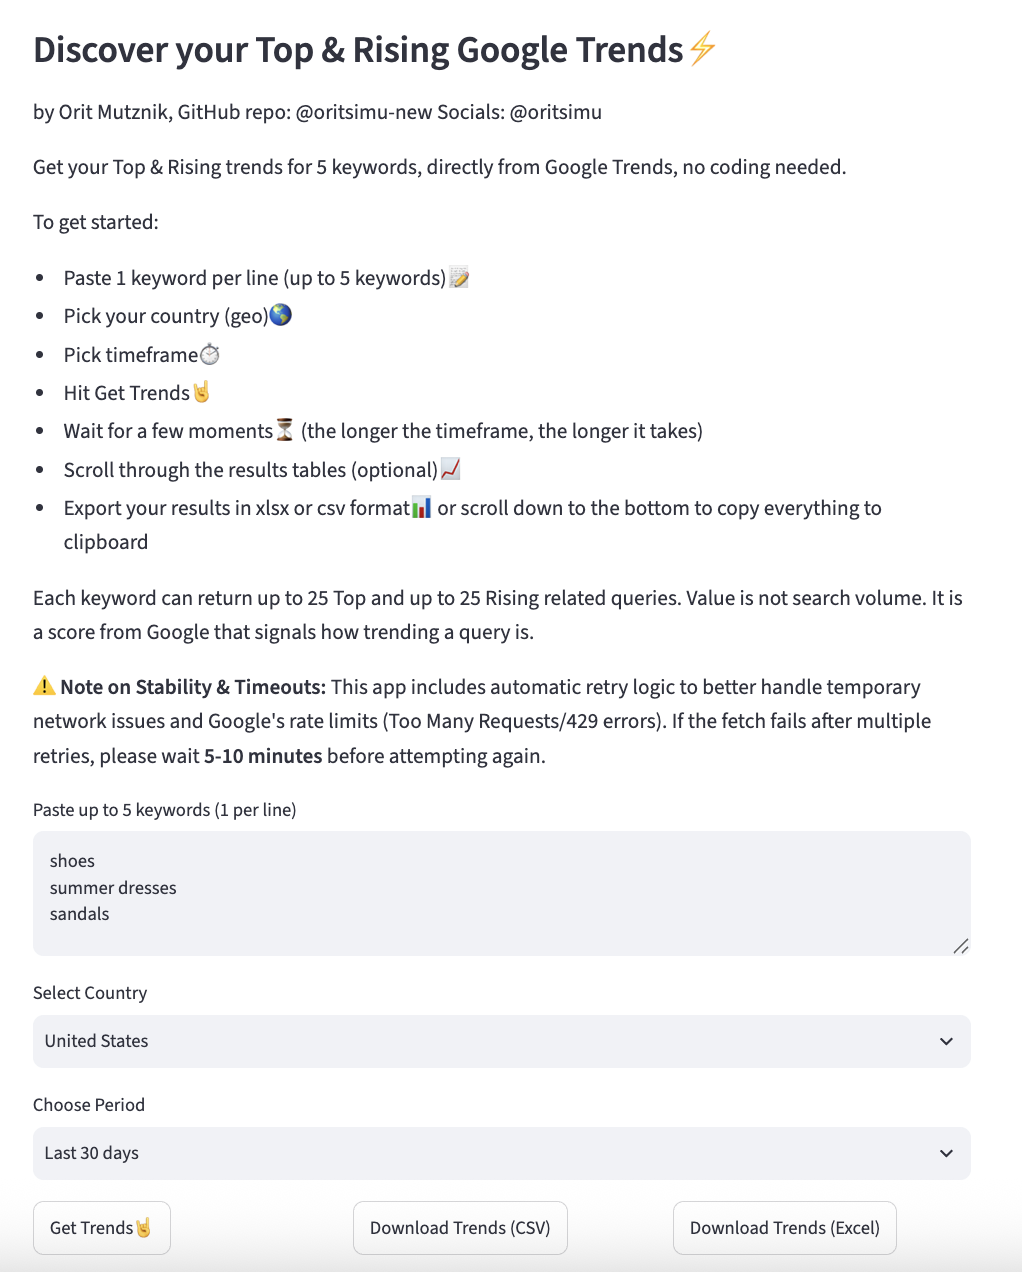
G-Trendalyser gives you up to 250 trending related keywords, top and rising, from up to 5 keywords you input.
The Google UI only lets you input 2 keywords at a time (in comparison mode), with a challenging interface and limited export options. G-Trendalyser, in its now revamped 2.0 version, allows you to see all top and rising trends in one place. You can easily export everything you see into CSV or XLSX or (my personal favourite) scroll down to copy all this data to clipboard and paste anywhere to avoid all those downloaded sheets.
It’s completely free to use and its only limitation (beyond up to 5 keywords at a time) is too many requests flagged by Google, which you can easily bypass by refreshing the window or connecting to VPN.
Go To G-Trendalyser 2.0 (it’s free!)
Usage limits worth knowing before you start
- Five keywords per run: That’s the Trends API limit, not mine.
- Pytrends gets saturated fast: G-Trendalyser runs on pytrends, the unofficial Python library for the Google Trends API. It tends to get blocked after a couple of uses, so until Google releases its Trends API properly to the public, you probably won’t be able to use this extensively. There’s a workaround, see below.
- Rate limits are undisclosed: Google returns a 429 whenever it decides you’ve asked too often. The app retries 5 times with exponential backoff, then asks you to wait 5 to 10 minutes.
- Pytrends is unofficial: Google doesn’t support it and can change the endpoints without warning, which is exactly what killed version 1.0 twice.
- Values are relative scores: Treat them as direction, never as volume.
- Breakout is not a number: It means growth above 5,000%, which usually means a query with almost no baseline.
How to use G-Trendalyser in 4 steps
No coding, no account, no install. The whole thing runs in your browser.
Step 1: Paste up to 5 keywords
One keyword per line in the text box. Five is the ceiling, because that’s what a single call to the Trends API will accept.
Step 2: Pick your country
The geo dropdown covers 40 plus markets, with the big ones pinned at the top.
Step 3: Pick your timeframe
Anything from the last hour to the last 5 years. The longer the timeframe, the longer it takes, so start narrow when you’re exploring.
Step 4: Hit Get Trends and export
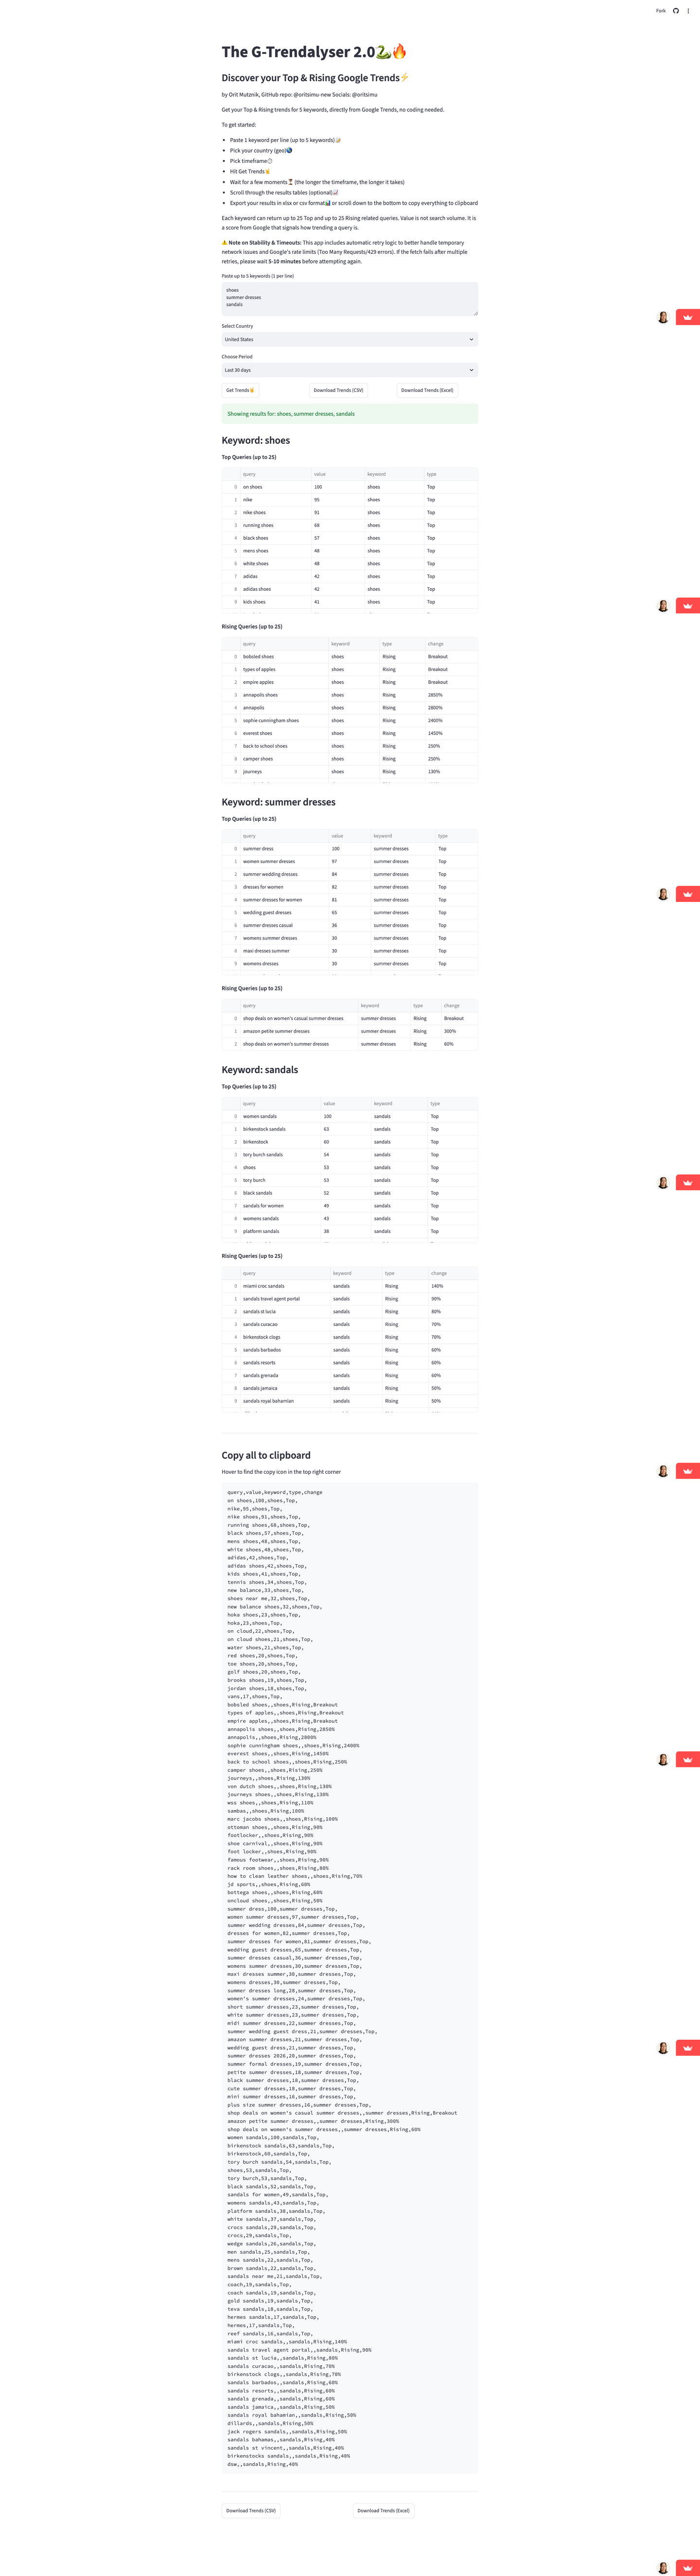
You get a Top table and a Rising table per keyword. Download as CSV or Excel from the buttons at the top or the bottom, or scroll to the copy-all block and take the whole thing to your clipboard.
What the output looks like
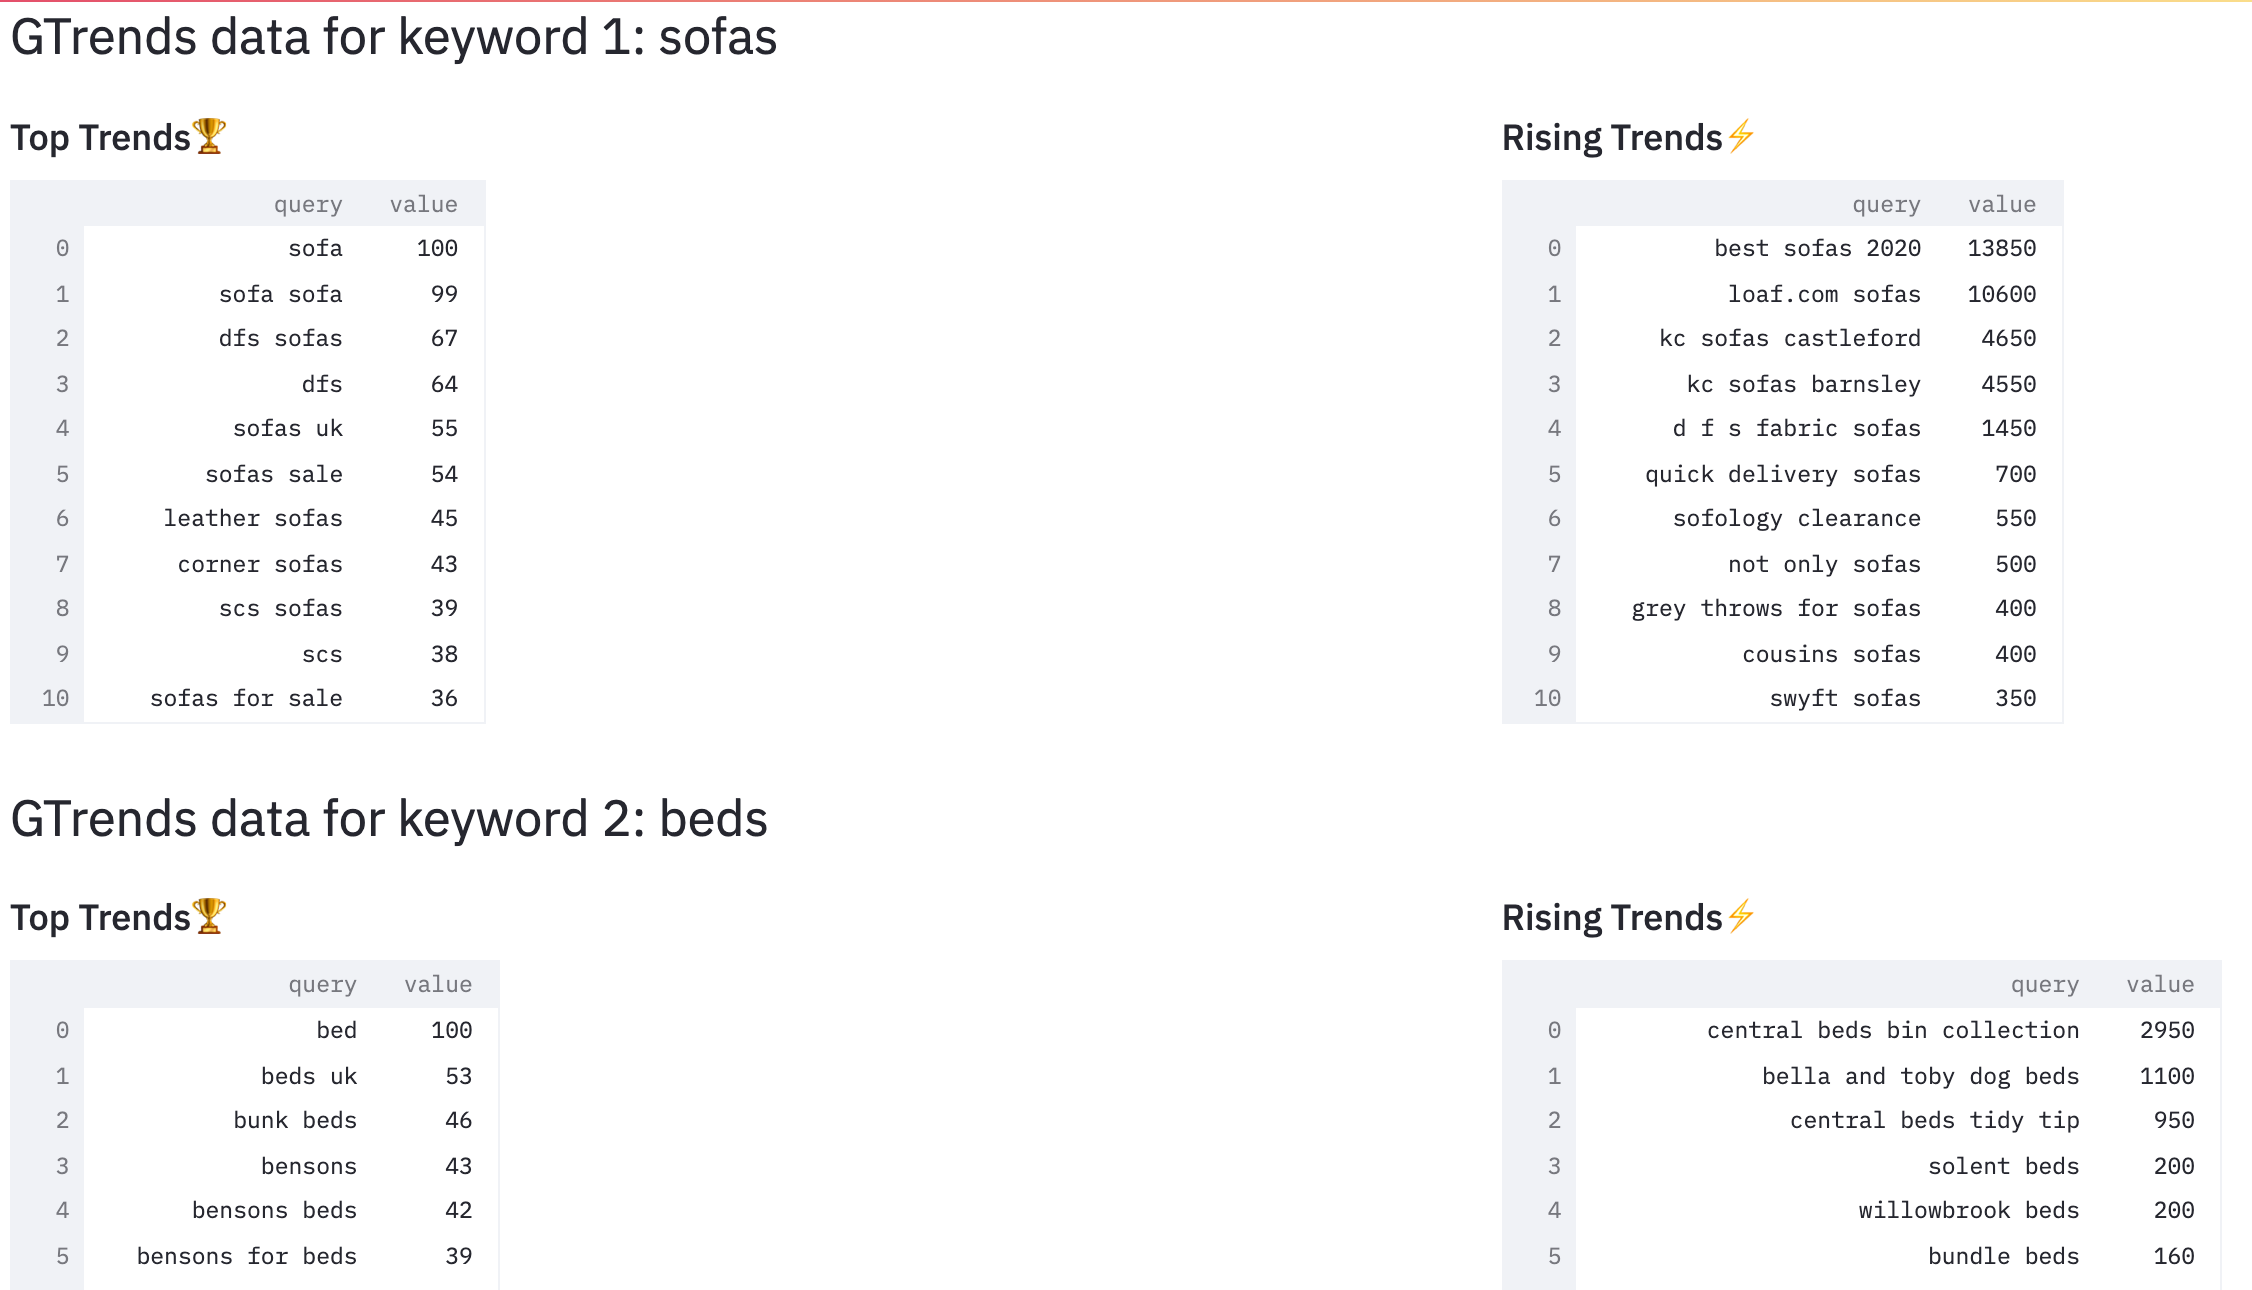
Each keyword returns up to 25 Top queries and up to 25 Rising queries, so a full run of 5 keywords gives you up to 250 rows.
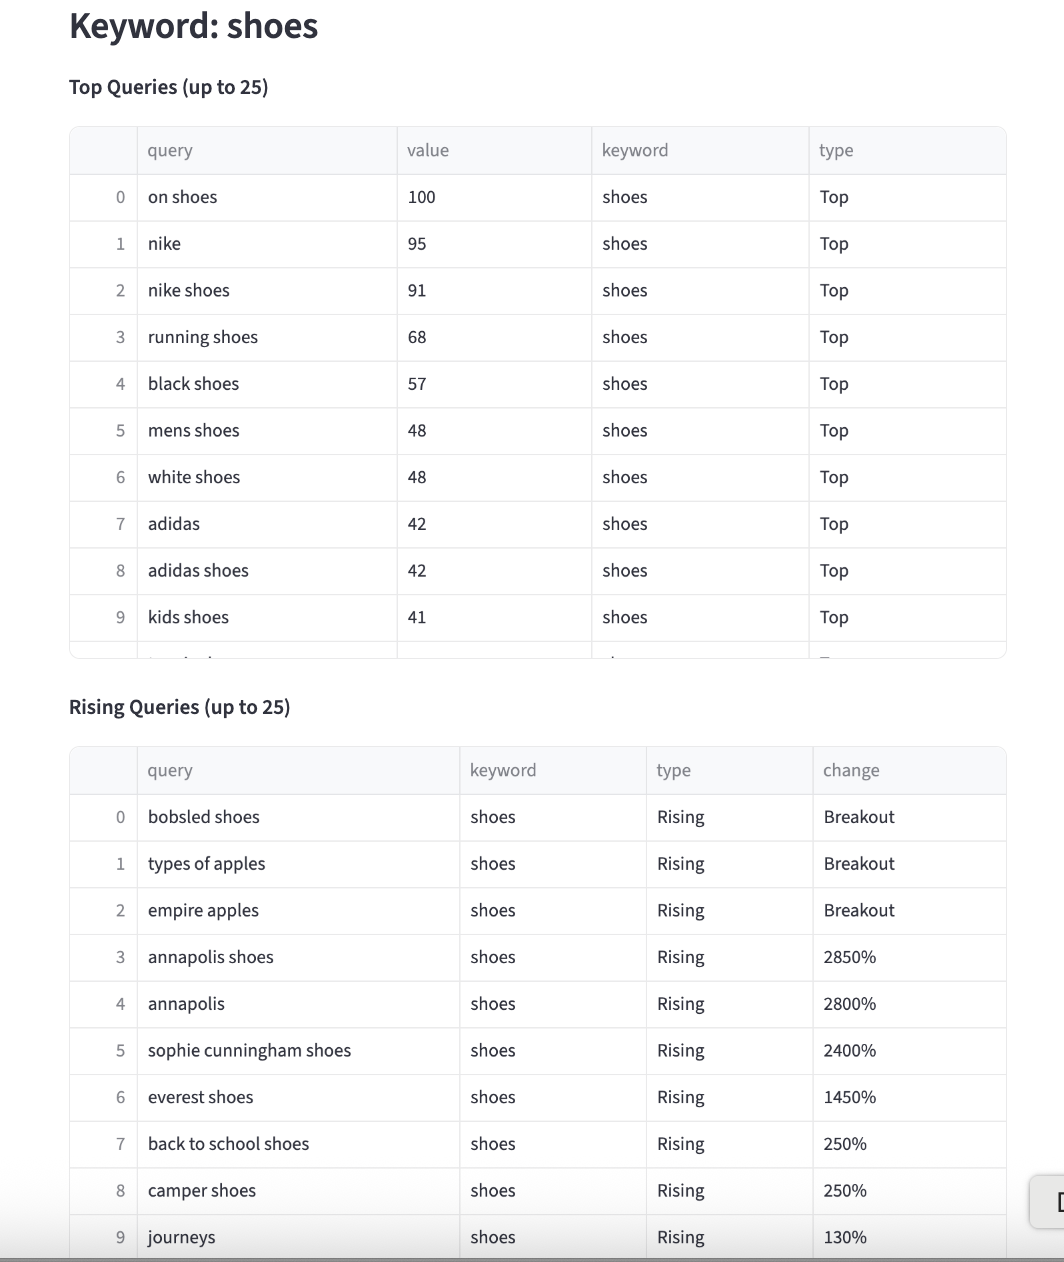
The two tables answer different questions:
| Table | What it tells you | What the number means |
|---|---|---|
| Top | The related queries with the most search interest over your timeframe | A score from 0 to 100, relative to the most popular query in that set |
| Rising | The related queries growing fastest over your timeframe | Percentage growth against the previous period, or Breakout |
Please note that the values do not represent search volumes, but these are more of an indication of how trendy the query is compared to others on that list. Breakout means growth over 5,000%, which usually means a query with almost no history before your timeframe started.
See the full output from a 3 keyword run
Was G-Trendalyser a Vibe Coding Project?
No. I built G-Trendalyser 1.0 in 2020. Back then the only way to “vibe-code” was to learn python programming (or any other programming language that was fit for purpose), learn how to use the different python libraries (Streamlit was a God-send!), learn how to use GitHub and spend all the time in the world on the Streamlit help forum and StackOverflow, of course.
Beyond a tool that I needed for work that had no equivalent in the market (not free nor paid) that I could use and also share with others in the community who may find it useful, it gave me the opportunity to push myself far outside of my comfort zone with coding, a skill I thought I could never learn.
Whilst G-Trendalyser 1.0 was not built with AI, having it reincarnate as the much improved G-Trendalyser 2.0 was only made possible thanks to AI.
Now that we got the most important bits out of the way, here’s my story, recipe blog style.
Too Long, Do Read: What ever happened to G-Trendalyser 1.0?
When G-Trendalyser was first launched in 2021 it was extremely popular for being simple, free and helpful to many SEO. I was so proud of myself for having built it myself years before AI!
!G-Trendalyser 1.0, the original Streamlit app
But at some point something went wrong. Pytrends, the Python library upon which G-Trendalyser was built (both 1.0 and 2.0 are) has been significantly upgraded and my pride and joy has suddenly become obsolete.
My skills could only go so far, so I hired a developer to help me fix it. He did. But when the library updated again and it was broken again, the developer was nowhere to be found, not to mention there is so much you can spend on something you’ll see no return beyond seeing your own creation in the wild - the app was broken beyond repair.
While this was all going on, I completely lost access to my OG GitHub account - it stopped accepting my password (which I knew was correct) and after probably too many restore attempts and no keys - the account was lost, which is where I completely gave up on G-Trendalyser ever seeing the light of day again.
What’s New In 2026? Re-building G-Trendalyser 2.0 From Scratch with ChatGPT
Years have passed, I left my fashion ecommerce SEO position and my G-trendalyser dreams behind.
Fast forward 4 years later, I returned to fashion ecommerce SEO and asked myself two questions:
- Where is my trusted G-Trendalyser when I need it?
- In a world of AI where people vibe-code apps all the time, why can’t AI fix mine?
AI couldn’t fix the old one, because the old one was gone along with the repo. What it could do was rebuild it. G-Trendalyser 2.0 was written from scratch with ChatGPT, on a new GitHub account, with the pytrends calls rewritten against the current version of the library.
The rebuild also fixed the thing that killed 1.0 twice. Version 2.0 wraps every Trends call in retry logic with exponential backoff, so a temporary rate limit or a dropped connection no longer takes the app down. It retries 5 times, tells you what it’s doing while it waits, then asks you to come back in 5 to 10 minutes if Google is genuinely refusing.
If you want the longer version of what building with AI is actually like, I wrote a full run through in Vibe Coding WordPress 101.
My Journey Building G-Trendalyser Before the Rise of AI
In a world where a keyword’s search volume is no longer the full picture, some of the most surprising and top performing content ideas actually come from breaking new search terms, i.e. (Google) trends.
While search volumes usually display a similar pattern of seasonality every year, unless something (circa 2020) radically changes, hidden gems in the form of new rising trends in a specific industry or around a certain topic are incredibly hard to be on top of.
In this article I will be sharing my way of making this simple, but I’ll also be sharing my learnings and processes, “recipe blogger style”, because it’s an inseparable part of coming up with this tool. But if you’re here for the bottom line, that’s ok too, here you go:
Go To G-Trendalyser (it’s free!)
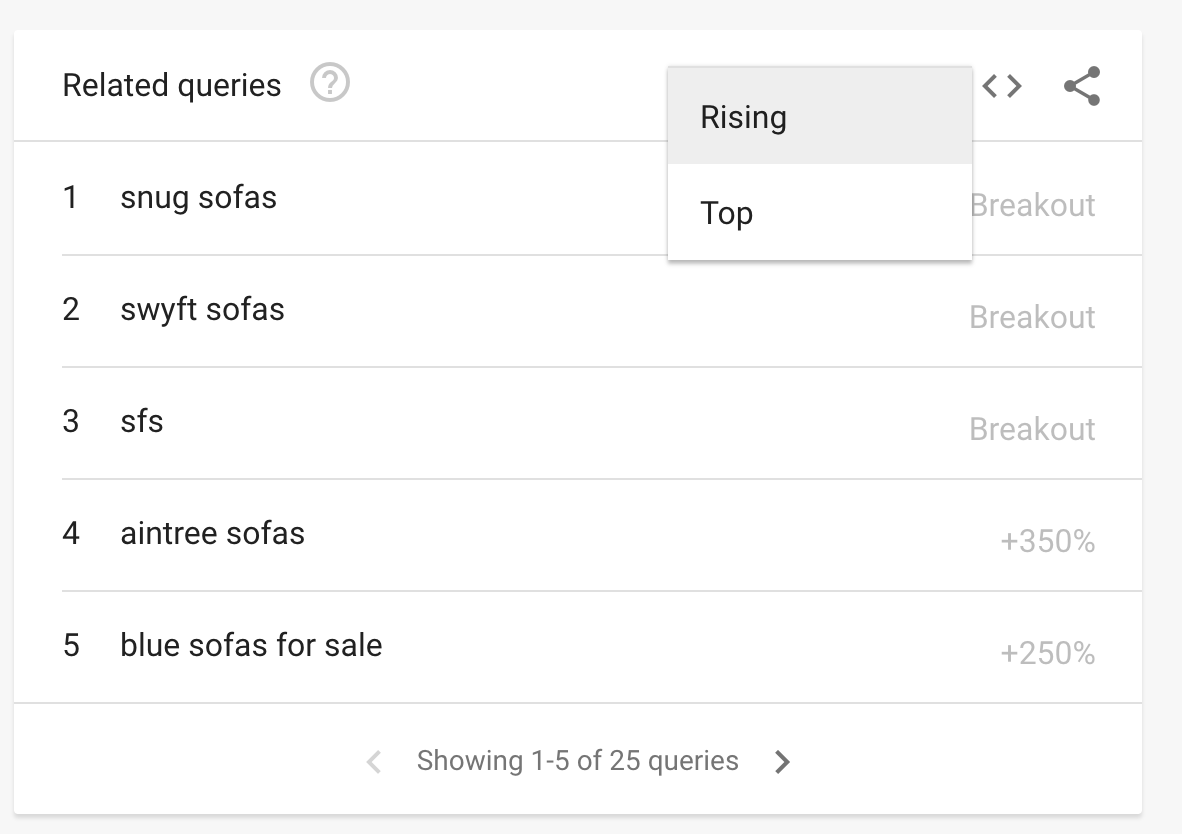
The Challenge: Making the most out of the ‘Related Queries’ box on Google Trends
Unfortunately, there’s no Looker Studio connector for Google Trends (though Google has been testing an official Google Trends API with select users, so this could finally be happening), so if you’re constantly on the lookout for new breaking content opportunities like me, you constantly reach this little box at the bottom of GTrends after you’ve searched for one keyword at a time per geo, per timeframe. You can download this information you get per search, but at the end of the day, you’ll probably be on this for a while exporting excels, one per keyword, joining them together, creating a visual or report. Not amazing.
The Idea: Using the Google Trends API with Python
When you really want this information and the straight-forward Looker Studio connector is not an option, a quick Google search would lead you to the understanding that the only way to get this information is by requesting this information directly from the Google Trends API and the only way to do that is by (Python) coding.
What are your options?
- Getting a Python developer to do this for you (if you know one/can afford one)
- Keep calm, learn Python & do it yourself (not easy, but definitely possible)
- Learn SOME python, enough to be able to adapt other pieces of code from the SEO community for your specific needs. (100% doable)
I went with door no. 3 (despite constantly working on improving my python skills so these skills can be considered more than “some python”), with a little bit of help from my dev friends back home (outside X) along with a help, guidance and tips from the SEO Community Python thought leaders, also known as the SEO Pythonistas.
The SEO Pythonistas
The SEO industry is really blessed with some of the most brilliant Python minds, from the Maestro that was Hamlet Batista (who I dedicate this post and every py-win to), to the brilliant SEO Pythonistas who were also inspired by Hamlet’s legacy, who keep creating amazing tools, scripts and offer tips and support for beginners.
The most active of these Pythonistas which you should definitely be following are Charly Wargnier (founder of SEOPythonistas), JC Chouinard, Greg Bernhardt, Ruth Everett, Daniel Heredia Mejias, Moshe Ma-yafit and “The Professor” Elias Dabbas.
Lucky for us and thanks to them, we won’t be inventing the wheel here. Also, making existing code do what YOU want, is actually not too bad of a skill to have.
The Solution (V1): Python with Google Colab (Template)
The wonderful Ruth Everett and Hülya Çoban have both written excellent posts and provided detailed pieces of code for you to try and experiment, as I did:
- An Introduction to Using Google Trends with Python, Ruth Everett
- Learn how to chart and track Google Trends in Data Studio using Python, Hülya Çoban (SEL)
- A better GDS dash & Google Colab, Hülya Çoban (X)
Ruth and Hülya both used the Google Trends API Python Library, PyTrends, which they explain how to use from scratch so you don’t have to. If you’re still not sure you’re ready for checking in the API itself, their articles include the code they’ve used (on Google Colab) for you to play around with by following their user-friendly instructions on your own copy, which I can guarantee I’ve tried & tested.
Before you panic, Google Colab is a way for developers to share their code with each other, a Google Docs for developers if you will. It’s less scary than it sounds and without ever working with it before, it was quite straightforward to understand with the instructions within provided by these experts. All you have to do is go to Runtime, then Run all, then you’ll be able to easily see the output from each box of code and see the code that generates it (disclaimer: I have briefly worked with Jupyter Notebooks which is the same concept but still different).
My Google Trends Dashboard (Colab)
By slowly understanding the output of each of Ruth and Hülya’s code boxes, combined with my beginner-intermediate level in python, I slowly started to adapt it to my needs.
Here’s my original Google Trends Analyser Colab. The current code on there will provide you with 3 months Google Trends Related KWs data for the UK Furniture Industry.
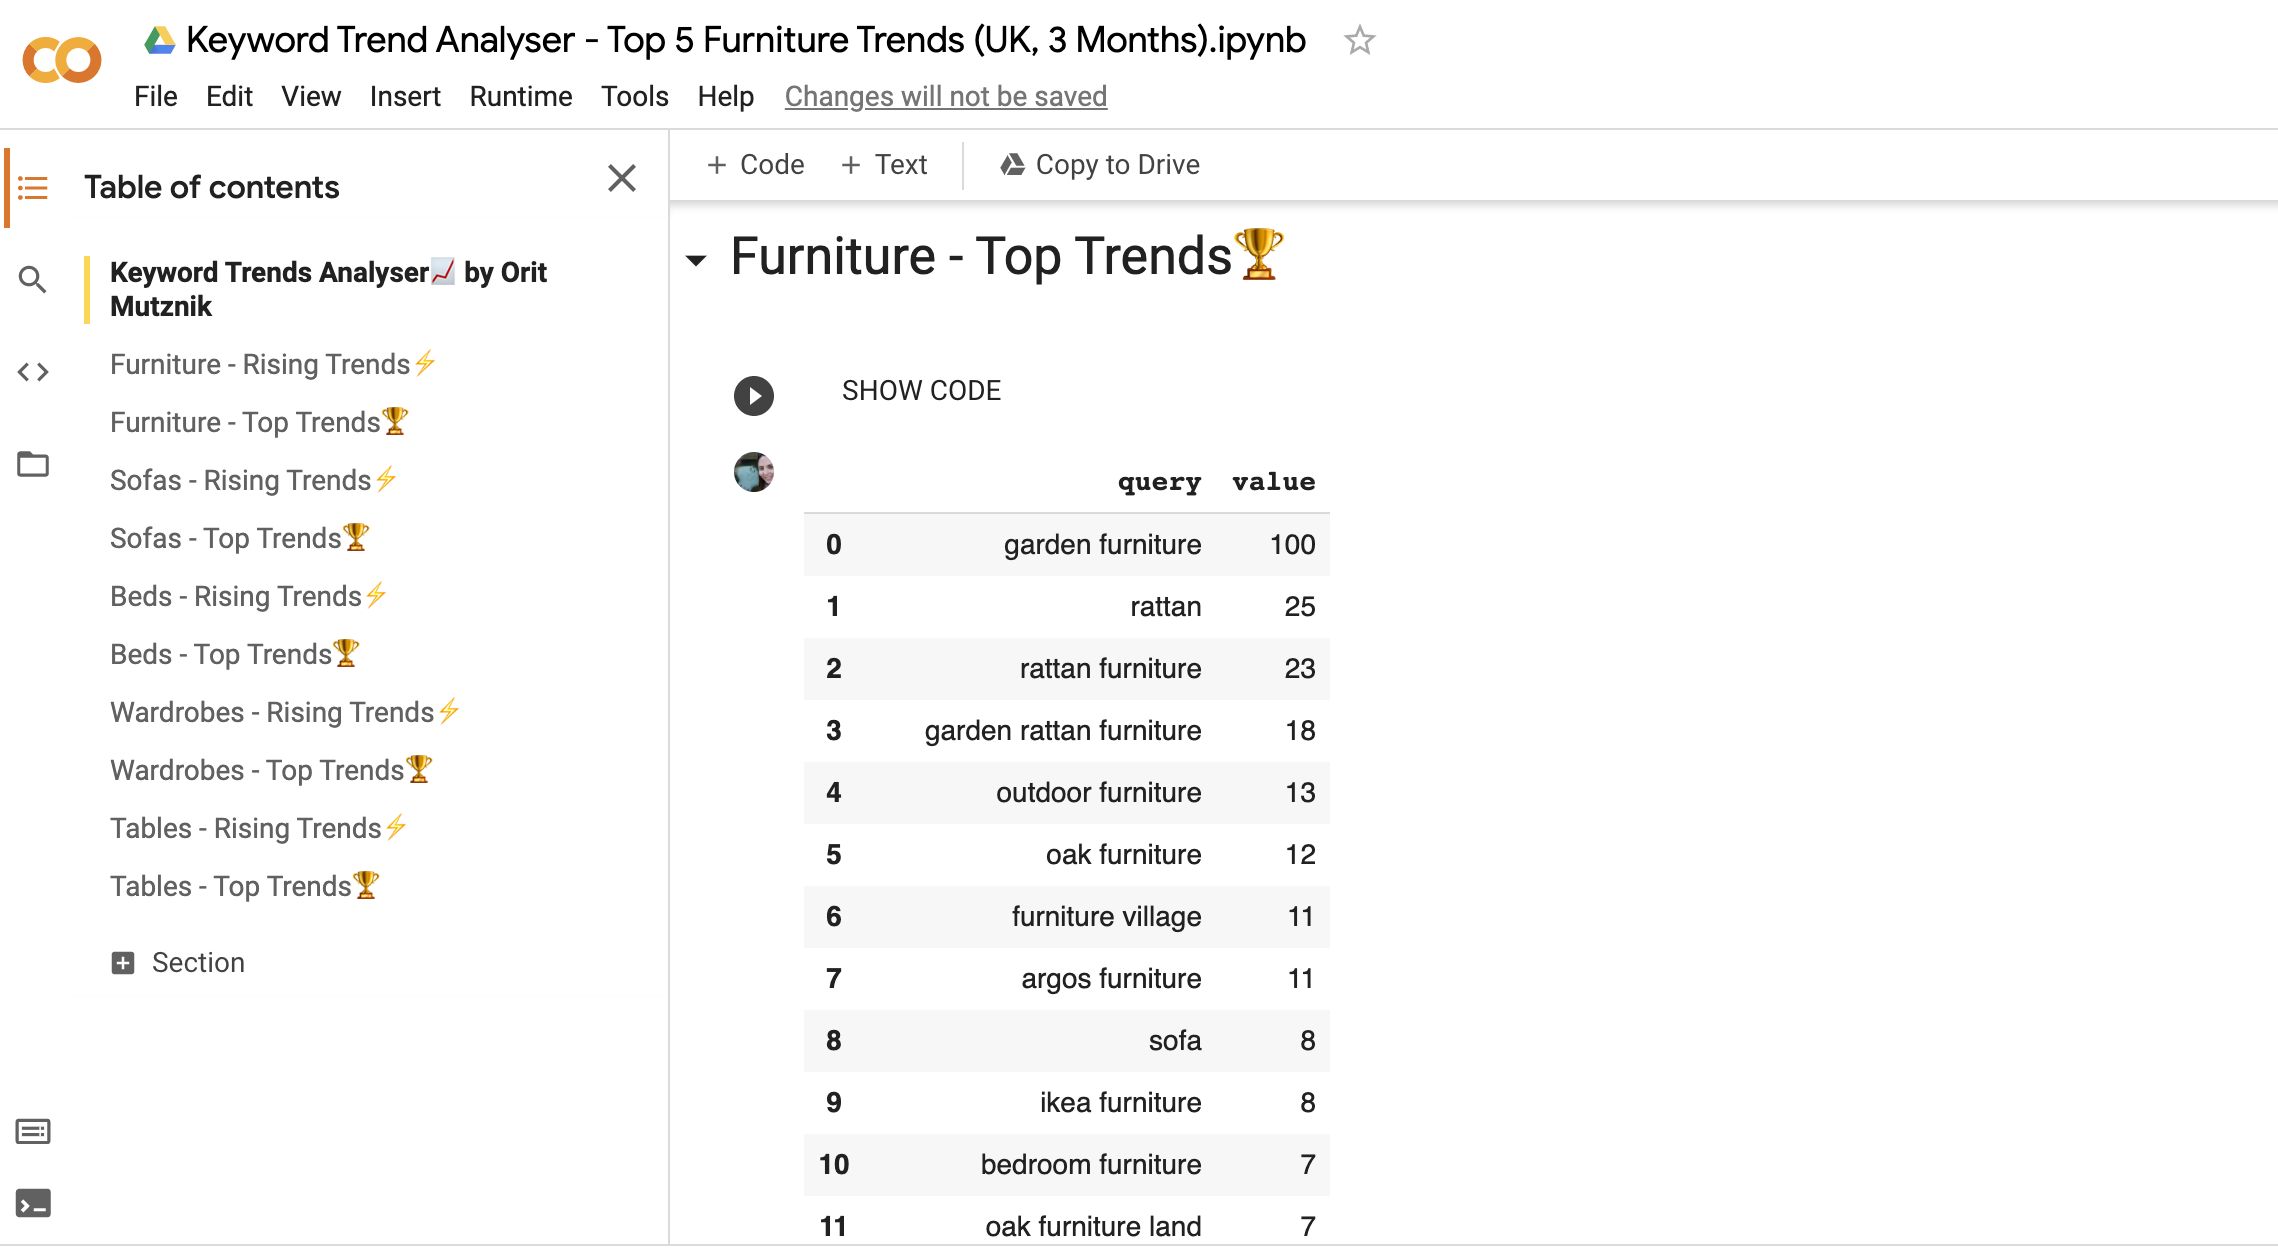
Clearly this is just an example, but you can create a copy of it, hit Runtime, then Run all and also double click to show code to understand exactly what the code does and where to change it (spoiler alert: Don’t think too hard, all instructions are inside the colab).
Though it’s not the prettiest thing in the world (though probably the prettiest colab you’ve seen), I’ve worked hard on making it utterly friendly with all of the emojis (gifs too, if I could) and hidden code (view, then Show/hide code) that just provides an output. After testing it on non-SEO, non-techy users, I can definitely say that just running it requires no coding skills whatsoever.
Adapting it doesn’t require python knowledge either, just follow my instructions and you’ll be fine (and if not, I’m on X or LinkedIn for you to reach me).
Just one last important note: Do not change the order of the boxes (even though you physically can) because the code has to run in order, especially on the 1st three boxes of code, but anything else can change. From order of the tables to the text inside the boxes etc.
Just bear in mind that due to API limitations, only 5 calls to the API can be done, i.e. up to 5 kws at a time.
Disclaimer: Google Trends with Looker Studio
The next step on Ruth and Hülya’s articles is to visualise it on what was then Google Data Studio and is now Looker Studio. This has been the hardest step (as of that point in time). Despite the colabs being provided, I just couldn’t get it to work and didn’t understand why. I also didn’t really understand the kind of output I’d be expecting.
What I’ve learned from my Looker Studio to Google Colab experience:
- There is no Google Colab to Looker Studio connection (there is a pattern here of me being unlucky with connectors). At least not directly anyway.
- The real connection is this: Google Colab, then Google Sheets, then Looker Studio (a little free kw stuffing there for ya).
- So the way it works is that their Google Colab output (once you’ve followed the code and also inserted the Google auth code), will produce 1 or 2 Google Sheets (depending on the colab), which you’ll then have to go to your Google Drive to discover and then use the Google Sheets connector to plug it in, so every time you run the colab, the report will update.
- However, this is not a simple colab to run: It includes the Google auth code to plug in, you gotta make sure it doesn’t create a new sheet all the time but just updates the current one, then refresh the data in Looker Studio.
- I am not aware of a python solution to achieve this and I don’t know any other programming languages, so I’ve decided to stick with my colab and drop the visualisation integration. You are welcome to experiment with it yourself with Ruth and Hülya’s codebase.
Conclusion: Leaving GTrends in Looker Studio to the pros. Over & out.
Quick note: I just remembered having a go at a Google Trends connector developed by StrategiQ. This connector (which is free and you just get an API key from them and you’ll be able to connect), is great for visualising the trend of a specific keyword or several ones. However, I wasn’t able to find information on using this connector for related keywords. Definitely worth a shot if this information is what you’re looking for.
Enter Streamlit: A Quick Beginners Guide
The colab was working, non-coders and non-seos were happy, but I was not. There was a new & shiny Python toy in town, often showcased by the works of Charly Wargnier, that I had a gut feeling that would be perfect to get me to where I want to be: The simplest (sexy) and most user-friendly way to get your Google Trends Related Keywords data, no coding required (from the end user).
So what is Streamlit?
Streamlit is the most user-friendly way to visualise your python data and the fastest way to build and share data apps. Charly has been one of their biggest supporters and his slick work on this platform made me extremely excited to work on it.
In simpler terms, Streamlit is actually a beautiful python library (installed from your terminal via pip install streamlit), that comes with a variety of nifty features, as you can see on this cheatsheet by user daniellewisDL, to turn your boring dark-mode python code output into a beautiful web app to display on your browser or on the web, instead of on the terminal window.
Charly has been incredibly helpful with quite a few tweaks on my app and getting me access to Streamlit sharing, which is what you need to deploy apps publicly. Thank you, Streamaster.
How to get started with Streamlit from scratch? (Python knowledge required)
- From your terminal window, install the Streamlit library by running
pip install streamlitorpip3 install streamlit, whatever works for you. - To make sure this worked, on your terminal window, run the command
streamlit hello. - This will appear on your terminal window and a new tab with some Streamlit demos (more important than you might think) will appear. If a tab does not open, just paste one of these addresses into a new tab on your browser.
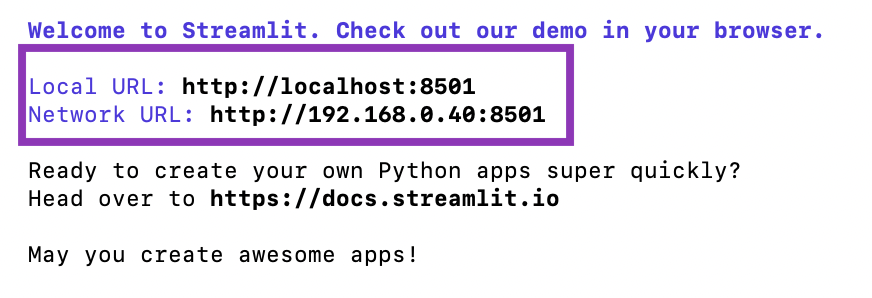
- The tab that just opened locally contains awesome demos that are an excellent way to get started. Each of the 4 demos include code below, that you can copy & save on a py file and then run them in your terminal with
streamlit run <file-name>.pyto play around with the code. - Just edit or add some of the commands in this cheatsheet and see what it changes. This is how it looks like:
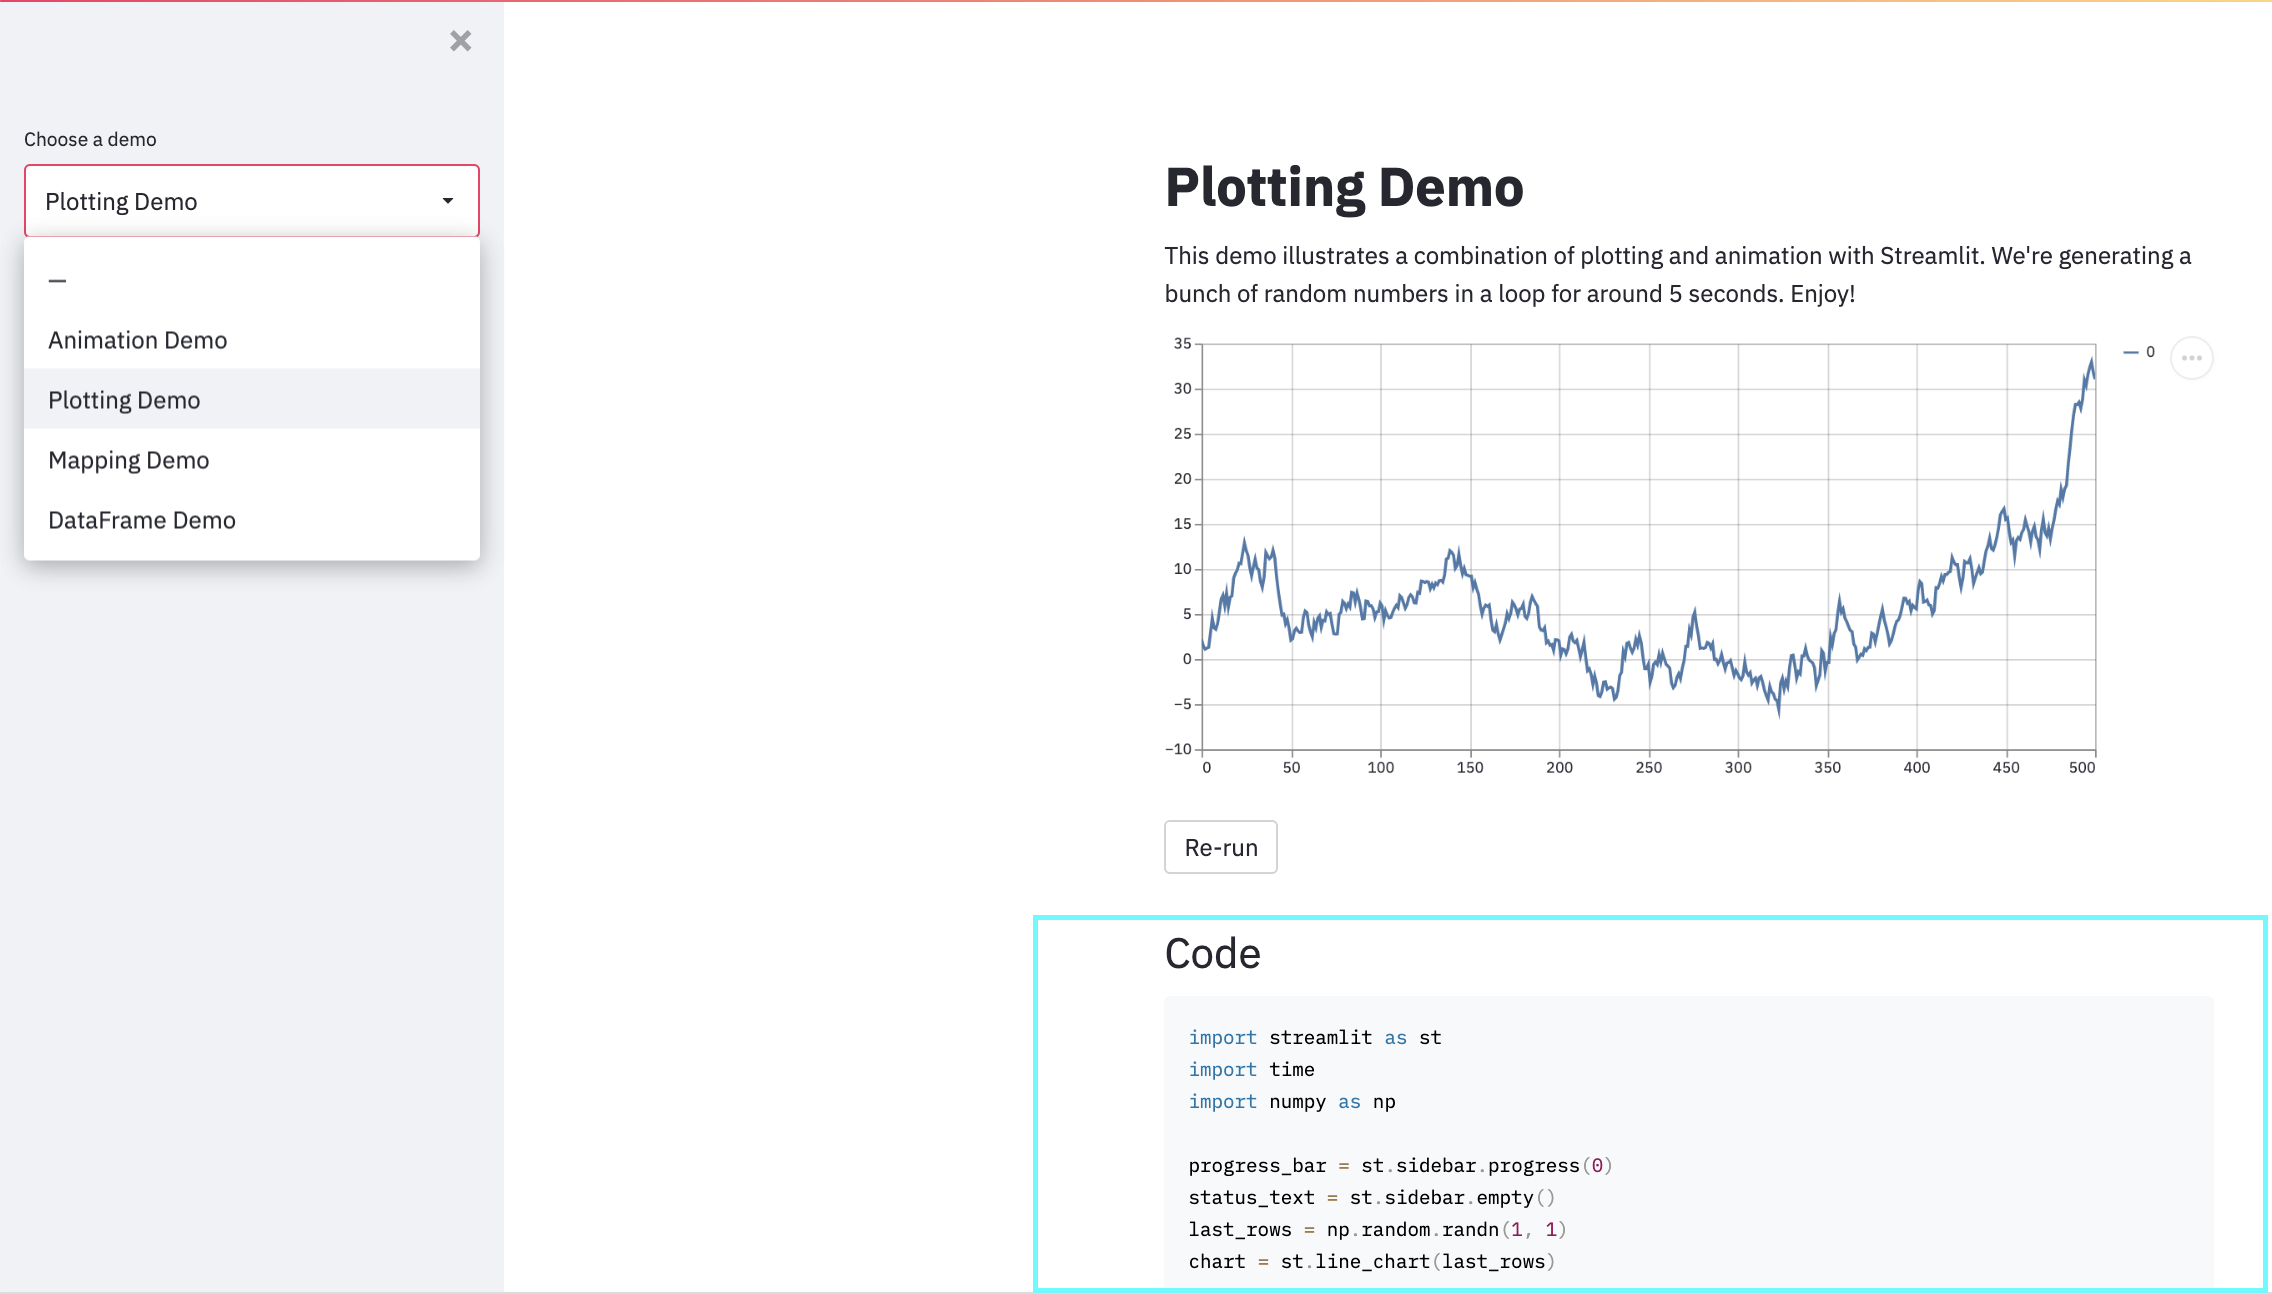
- To keep learning from there, go to the Streamlit Gallery, where you have sample apps & components (which where I learned the most from) and though the bad news is that no, you can’t skip the documentation (I’m saying “bad news” because I’m more of a tl;dr person and I love cheatsheets). But the good news is that the Streamlit documentation is as clear, beautiful and user-friendly as the apps you can create with it. I wish they were all like this.
- The Streamlit community is also really helpful when you get stuck.
- Hot tip: Follow Charly on X for tips and new Streamlit projects. Check out his Streamlit portfolio here.
How do I deploy a Streamlit app and share it with the world?
- Make sure you have a GitHub username before you sign up to Streamlit.
- Push your app to a GitHub repo.
- Deploy that repo from Streamlit Community Cloud, which is free for public apps.
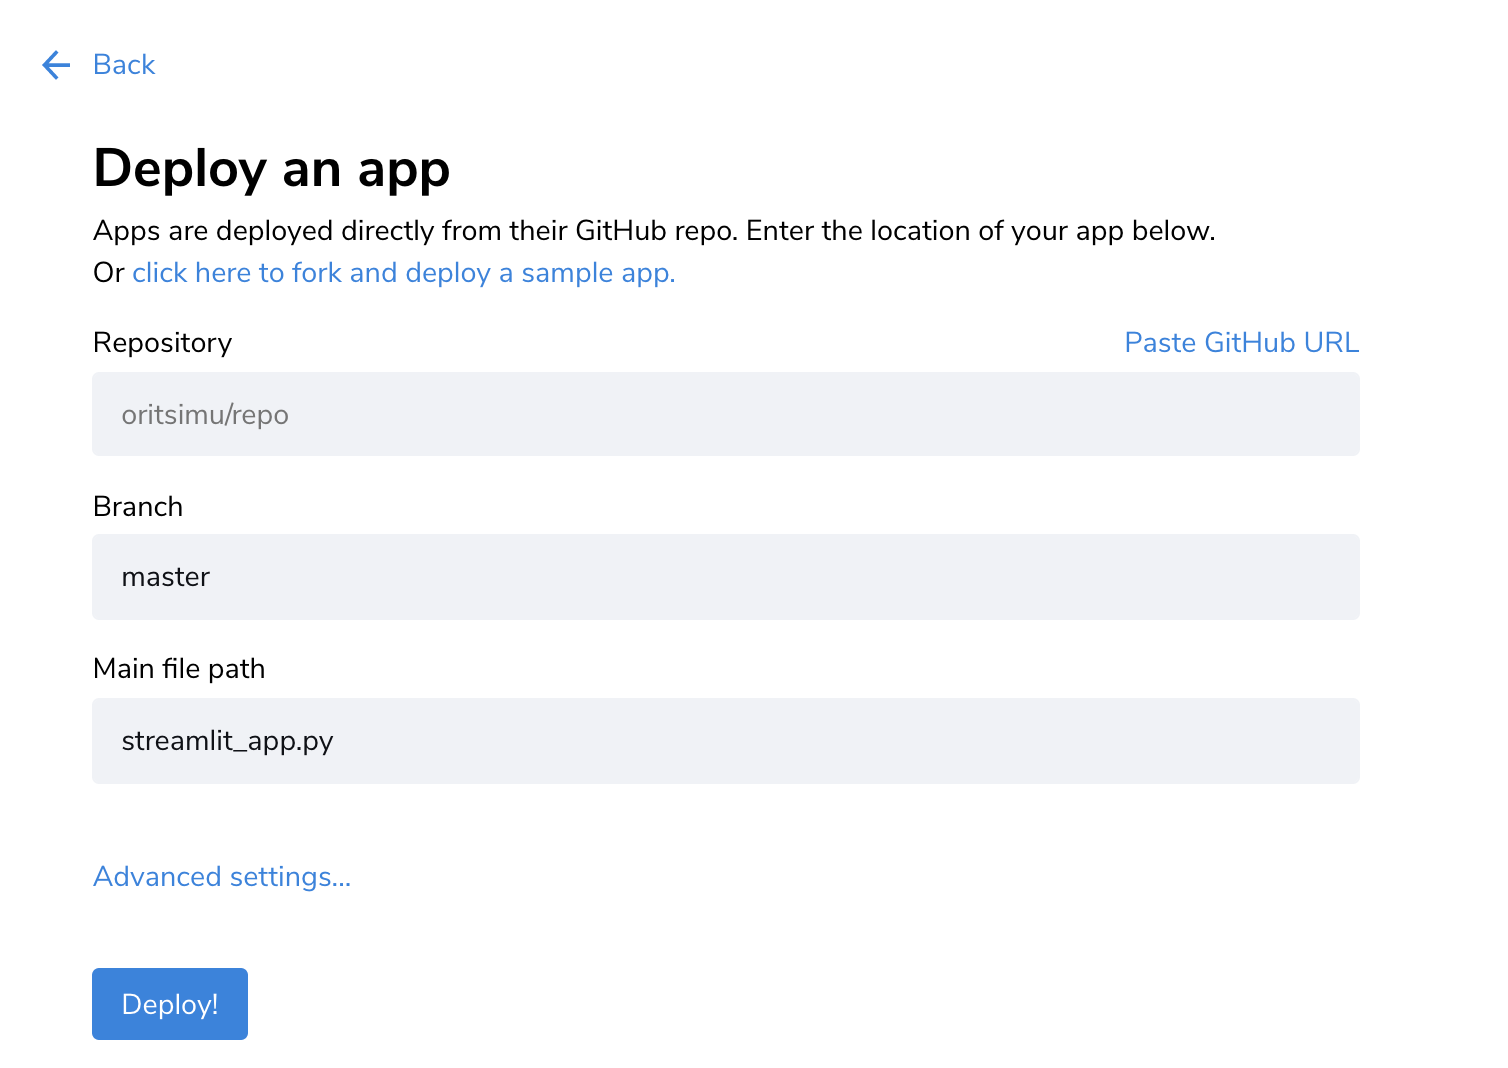
Community Cloud is what Streamlit sharing became. It no longer needs an invite, so this step is far quicker than it was in 2021.
So without further ado, fast forward to me learning a tonne on my own and from my pythonista friends, my solution is now ready, exactly the way I wanted. Drumroll please:
Introducing The Solution (V2): The G-Trendalyser 2.0 (Free SEO tool, No coding required)
Just like a good recipe site, I left the best to the end (but I did provide a table of contents for you to get directly to this point, so in case you used it to get here, you missed a killer cheesecake recipe! Just kidding). Here you go!
Go To G-Trendalyser (it’s free!)
How it works:
- Type or paste your keywords (up to 5)
- Choose your country (geo)
- Choose your timeframe
- Hit ‘Get Trends’ at the bottom
And…. Voilà! You’ve got your related trending keywords.
But wait… there’s more! Get my code here
The whole app is one Python file. Here’s the part that does the actual work, the retry loop that made 2.0 survivable in a way 1.0 never was:
pytrends = TrendReq(hl="en-US", tz=360)

MAX_RETRIES = 5
INITIAL_DELAY = 5
related_queries = None

for attempt in range(MAX_RETRIES):
    try:
        current_delay = INITIAL_DELAY * (2 ** attempt)   # exponential backoff
        pytrends.build_payload(kw_list, timeframe=timeframe, geo=geo_code)
        related_queries = pytrends.related_queries()
        break
    except pytrends_exceptions.TooManyRequestsError:
        if attempt < MAX_RETRIES - 1:
            st.warning(f"Rate limit hit (429). Retrying in {current_delay} seconds...")
            time.sleep(current_delay)
        else:
            st.error("Failed after multiple retries. Wait 5-10 minutes and try again.")
            st.stop()
Everything else is presentation: A text area for the keywords, two dropdowns, a dataframe per table and three export paths.
If you’re a python dev and you want to fork this repository to have a little play, go to my GitHub Repository here.
Fork it, run it locally with streamlit run app.py, or deploy your own copy to Community Cloud.
A reminder on the limits, plus the fork workaround
Worth repeating, because it’s the thing most likely to frustrate you: G-Trendalyser is built on pytrends, the unofficial Python library for the Google Trends API. Pytrends gets saturated quickly and Google blocks it after a couple of uses. Until the Google Trends API is properly released to the public, you won’t be able to use this heavily on a shared app.
The workaround is to fork the repo and adapt it to your own needs. A personal fork gets its own rate limit instead of sharing one with everybody else using my app, so it’s far more reliable if you’re running this regularly.
You don’t need to be a python dev to do it. Hand the repo to Claude, tell it what you want changed and let it walk you through the fork and the deploy. That’s exactly how I rebuilt 2.0, which is the whole point of Vibe Coding WordPress 101 if you want to see the approach applied to something bigger.
If you’d rather pay for something that already solves the rate limit problem, look at Glimpse. It’s a better solution than anything I can give you for free: Real search volumes rather than relative scores, trend forecasting, a channel breakdown showing where a topic is being discussed, plus a Chrome extension that sits on top of Google Trends itself. There’s a free tier to try it on.
Any questions? Ideas? Feedback? Feel free to contact me on X or LinkedIn.
Google Trends tool FAQs
Is G-Trendalyser 2.0 free?
Yes, completely. There’s no account, no sign up and no paid tier. It runs on Streamlit Community Cloud, which is free for public apps.
How many keywords can I check at once?
Up to 5. That ceiling comes from the Google Trends API, which accepts a maximum of 5 terms in a single payload. Each keyword returns up to 25 Top and up to 25 Rising related queries, so a full run gives you up to 250 rows.
What do the numbers in the Top table mean?
They’re relative interest scores from 0 to 100, not search volumes. The most popular query in your set scores 100 and everything else is scaled against it. Two runs with different keywords will produce different scores for the same query, because the reference point changes.
What does Breakout mean in the Rising table?
Breakout means the query grew by more than 5,000% against the previous period. It almost always means a term with very little search history before your timeframe started, so it’s a signal of novelty rather than of size.
Why am I getting a Too Many Requests error?
Google rate limits requests to the Trends endpoints and doesn’t publish the threshold. G-Trendalyser retries 5 times with exponential backoff before it gives up. If it still fails, wait 5 to 10 minutes, refresh, or connect through a VPN and try again.
Can I export the data?
Yes, three ways: CSV, Excel, or the copy-all block at the bottom of the results, which puts the whole dataset on your clipboard so you can paste it straight into a sheet.
Does G-Trendalyser use the official Google Trends API?
No. It uses pytrends, the unofficial Python library that reads the same endpoints the Google Trends interface uses. Google has been testing an official Trends API with selected users, which would make tools like this considerably more stable.
Can I run G-Trendalyser myself?
Yes. The code is public on GitHub. Clone the repo, run pip install -r requirements.txt, then streamlit run app.py to run it locally, or deploy your own fork to Streamlit Community Cloud. A private fork is the better option if you’re running a lot of queries, since the rate limit is applied to the app.
Work with me on trends and content strategy
If you’re trying to turn breaking search demand into a content plan that actually ships, or you want a second pair of eyes on how your team is using trend data, tell me what you’re working on.